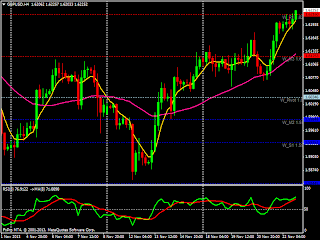
Showing as usual to highlight the importance of the W pivots, support and resistance levels and the typically number of trades that can be expected in a week 2-5.
All the world's a stage and we are merely players. Discipline is the bridge between goals and accomplishment.
Saturday, November 30, 2013
Friday, November 29, 2013
Trend v support and resistance
You will never know which will win the day, trend or support and resistance.
If you were to buy here around 1.4960 fine but just be fully aware of what you are up against:
If you were to buy here around 1.4960 fine but just be fully aware of what you are up against:
- Yesterday we failed to go higher closing as a hanging man,
- Its Friday pm and there's more than a few traders that avoid Fridays all together,
- 1.4960 is in and around yesterdays high,
- The run up is now 950 pips,
- We are in a major resistance area from August.
Thursday, November 28, 2013
Trading 101
Trend
Have a higher time frame definition of trend, whatever works for you. It could be MACD cross, a moving average cross, price above or below a moving average, a candle pattern etc etc etc.
Have a look at this euraud D chart. I look for the 3-7 day turns in the market that result in a move above or below the 8lwma or RSI cross. That's my general trend definition.
Taking it one step further. The x's mark weak candles that cannot cause a cross of the 8lwma or RSI. Could they be the start of a counter trend move, sure. Just as likely they are a pause before continuation of the trend. I have also added support/resistance levels for proven turns in the market. Could you at times get a better entry than waiting for the 8lwma to cross, of course yes. Most often though the 3-7 days turn will play out before a new trend forms.
Whys that? Well the big boys can't dump all their orders onto the market at once, they wouldn't get filled. It takes some time to turn a big ship around.
Lower time frame entry into trend
Once the D trend has shown itself in terms of your trade definition (e.g. D 3-7 day turn that switches price across the 8lwma, MACD cross, RSI above or below 50 level) there are normally many opportunities to enter from lower time frames before the next trend forms. For example buying 1hr dips in uptrend, selling 1hr rallies in down trend.
So if you have a view that from 21 Nov the D chart is suggesting an uptrend and therefore its buy only, then the issue is on what basis will I buy? You could use an oscillator going over sold, retrace below then move above a moving average, candle patterns from a pivot/round number/fib or some kind of price action like an engulfing close on a lower time frame like the 1hr chart. That's up to each trader but its a lot easier to have a view of the trend and trade in that direction than trying (but inevitably failing) to capture each move in the market.
Summary
Have some definition of higher time frame trend. Then look for an entry signal from a lower time frame. Then research that they work, the majority of the time. Buying dips in an uptrend and selling rallies in a down trend is a trading basic that will not change.
Sunday, November 24, 2013
4hr charts W pivots
As usual there are 3-5 trade possibilities from the 4hr chart simply looing at the RSI cross or price trading above/below the 8lwma.
Subscribe to:
Comments (Atom)


