Sunday, April 8, 2012

Method expanded multi time frame analysis

We look to follow the daily candles as much as possible. Trying to keep things as simple as possible we:

1) try and identify support and resistance levels
2) look for positive/negative closes to follow through the next day (as we believe this will hold true approx 70% of the time)
3) watch for divergence
4) Look for D chart higher lows/lower highs, double tops/bottoms, engulfing candles, hammers/shooting stars, morning/evening star patterns
5) rsi crossing its moving average or crossing the 50 line

If we are confident that a confluence of the above exists then the next day we will look to trade in 1 direction only. This keeps us out of some head fake moves typically around London open and the US open (weak counter trend 1hr candles in and around US open just as big a fake move as LO).

From there we are looking for good 1hr set up candles and the 5 min higher low/lower high that follows for entry.

There are some days where we will consider buying or selling but the most success follows everything lining up on D chart to trade in 1 direction.

The attached chart shows some areas we have identified as possible SR levels. Some examples:

The first chart shows GU with SR levels identified.


4 morning/evening star patterns. The days following these patterns we would be trading 1 direction only.


Double bottoms and higher lows would see us buying only on the days following these positive closes.


Once we have our view from D chart then its a matter of waiting for 1hr to give a good signal candle and then 5 min hl/lh.

Saturday, January 21, 2012

Perfect set up


Mrs V is no longer a fan of ej and she asked for au to go up (watches 3 currencies).

This is about as good a set up as you'll get. Trend is clear, D chart rsi crossed up and we are above 50 level. 1hr retrace and move up on rsi above 50. 5 min higher low in trend (short term as shown by the 5 min ema's and in line with long term D chart view).

Nice set up, she wasn't in front of the computer at the time.

3rd trade of day


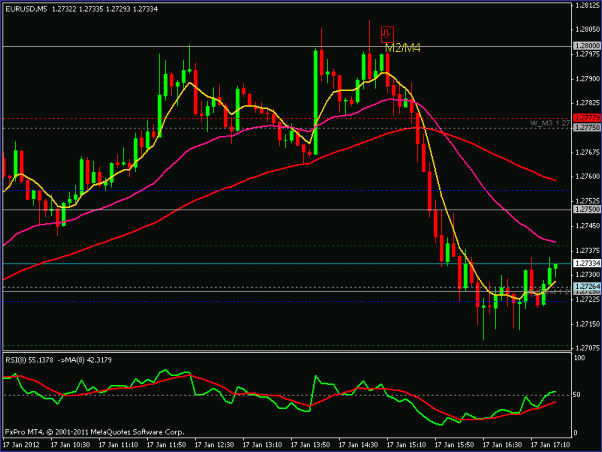
As mentioned often this pre US open sideways chop or slightly higher low is a counter trend/London session fake out. Mrs V sold the 2b exited +19 (20 pip bank Hall of Fame happy).

2nd trade of day


Trade 2, nice retrace and reject of 2925/D pivot. Little/no lower wick cross of 8 lwma, normally a safe trade in trend. Unfortunately exited at BE after target not reached.

1hr set up into trend at possible turn area


Daily identified this area as a possible R level. 1hr showing divergence with a doji. price went below the Asian S level. Nice lh little/no lower wick, out just shy of +20.

MA's a mess but ....................


Our other basic trade when the ma's are turning is to trade the lh back into main trend. Here the lh is clear but she didn't think the 1hr candle was quite a good enough set up.

25 ish pip retrace to 50 psych level. Mrs v took this hl exiting just before the news. Solid close little/no upper wick candle crossing the 8 lwma.