To be successful as a trader one of the many things you need to do is get comfortable with the time frame you are trading. I am comfortable taking entries off the 1 min chart as per recent posts in the last couple of months.
It is not however a case of jumping in and trying to scalp every move which I accept that I cannot do and certainly don't want to start trying. It is using some basic information to try and gauge strength and weakness for short term trend and to use support and resistance levels.
See some of the recent posts titled agreement across pairs. Basically looking for 5 min charts to show some form of agreement between different pairs to confirm that you are trading broader strength/weakness:
- a cross above/below stochastic 20 20 1 (same as W% R 20), then
- making double bottoms/higher lows or double tops/lower highs
Additional information can be gained from higher time frame charts that just focusing on 1 min can easily miss.
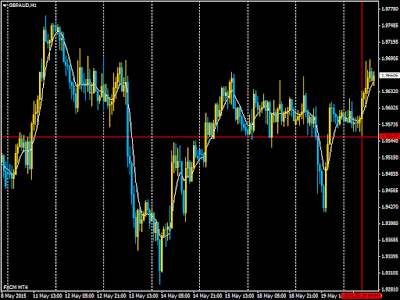
Today there were easily identifiable support levels on gbpaud, gbpnzd, and euraud. The 9 am 1 hr candles for the gbp pairs and euraud were positive closes rejecting a move lower. There is agreement then between gbp against aud and nzd and euraud. So now you have an identified support level, agreement across pairs for a move up. In terms of this strategy we would be looking for agreement on the 5 min stochastic above the 50 level and double bottoms/higher lows.
Then we would be looking at the 1 min to see which pair is highest on Clives TT indicator (measures the steepness of moving averages) and giving the cleanest higher lows/a b c moves to time our entry in line with the short term trend.


No comments:
Post a Comment