Monday, November 16, 2015

Test of range

Received a quick question on test of range against the well known break and test of range.

On 2 occasions this morning price came down  to the lower end of range around 2.1370 and moved, see the arrows up, going back to the W pivot 2.1394. The importance of the W pivots shown again.

After the Frankfurt open price again moves down to the lower range which holds. We get a hammer, then a classic doji before the engulfing close at the range. Especially considering the time of day after FO, dare I say it 30 minutes into the session (a trader I greatly respect told me about the FO reversal at this time) and volumes now a little higher.

If the lower end of the range was so strong why did price not react like it did twice before and move up?

Like everything else in trading just be aware of the set up and look for it when back testing.


Sometimes it all comes together

GBPAUD straight forward set up. Price tried to move up before Frankfurt open, clean AB move lower, test of lower range, small retrace to set up the lower high. Negative close candle with little/no lower wick closed at/just beyond the range. Perfect set up.


Sunday, May 24, 2015

4hr charts W pivots

As always showing the importance of the W pivots, support and resistance levels and the numbers of moves that can be expected in a week (typically 2-5).


Friday, May 22, 2015

Agreement across pairs 22 May

Both euraud and eurnzd bounced from support levels as seen on 1hr. Even without that the 5 min stochastic is above the 50 level after London open (green line) and we have multiple bottoms/higher lows. So we have agreement across pairs and the bias is up. The focus would then switch to the 1 min to find higher lows for entry.


Wednesday, May 20, 2015

Agreement across pairs - Following the 1hr?

To be successful as a trader one of the many things you need to do is get comfortable with the time frame you are trading. I am comfortable taking entries off the 1 min chart as per recent posts in the last couple of months.

It is not however a case of jumping in and trying to scalp every move which I accept that I cannot do and certainly don't want to start trying. It is using some basic information to try and gauge strength and weakness for short term trend and to use support and resistance levels.

See some of the recent posts titled agreement across pairs. Basically looking for 5 min charts to show some form of agreement between different pairs to confirm that you are trading broader strength/weakness:

- a cross above/below stochastic 20 20 1 (same as W% R 20), then
- making double bottoms/higher lows or double tops/lower highs

Additional information can be gained from higher time frame charts that just focusing on 1 min can easily miss.

Today there were easily identifiable support levels on gbpaud, gbpnzd, and euraud. The 9 am 1 hr candles for the gbp pairs and euraud were positive closes rejecting a move lower. There is agreement then between gbp against aud and nzd and euraud. So now you have an identified support level, agreement across pairs for a move up. In terms of this strategy we would be looking for agreement on the 5 min stochastic above the 50 level and double bottoms/higher lows.

Then we would be looking at the 1 min to see which pair is highest on Clives TT indicator (measures the steepness of moving averages) and giving the cleanest higher lows/a b c moves to time our entry in line with the short term trend.


Sunday, May 10, 2015

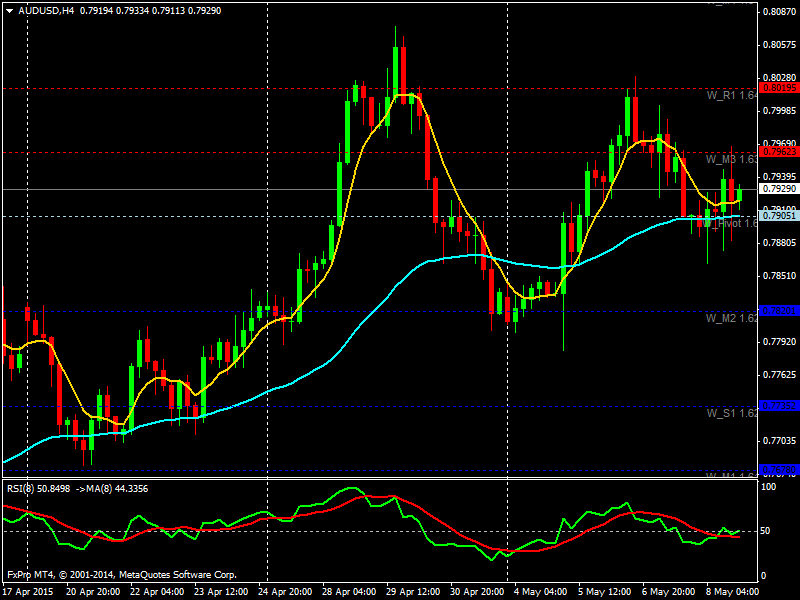
4hr charts W pivots

Just showing again to point out the importance of the W pivots, support and resistance areas and generally the number of good moves that can be expected in a week (typically 2-5).


GBPAUD sell 101 pips

The gbpaud daily chart clearly shows the potential resistance level around W M4 1.9637. Sold 1.9630. We were out on Friday afternoon so missed an opportunity to exit but +101 pips is not the worst ending for the trade.