No trades yesterday the decent moves happened quite early.
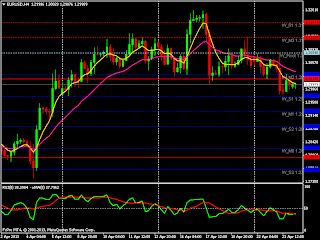
EUR - D closed positive yesterday at the 1.3100/20 resistance level. 4hr on higher low. Bias up with potential to fall from yesterdays highs.
GU - D closed a shooting star still well above the 8lwma. 4hr still on higher low flow, bias up.
EJ - D closed a doji with the Feb highs support level holding, still below 8lwma. 4hr above 8lwma but in view of the upper wicks bias down with the potential to bounce from 127.00/60 support area..
Tuesday, April 30, 2013
Monday, April 29, 2013
EUR GU EJ 29 April
EUR - Last week closed a hammer after a shooting star, the W chart clearly showing the indecision in the market. D closed a doji, 4hr last close a doji. 1hr gapped up but has already closed. All in all a mess, no bias.
GU - Not much follow through higher on Fri after Thursdays over sized positive close. 4hr showing negative divergence on Fri. Flow is clearly up, bias up.
EJ - W closed negative and we are now at the Jan Feb W chart highs (of the candle bodies). D negative close below 50 RSI. 4hr has had a strong move down with almost no retrace. 1hr showing positive divergence. Potential for a bounce up, bias is down.


Sunday, April 28, 2013
4hr charts W pivots
The importance of W pivots, support and resistance levels and the numbers of trades from a 4hr chart all to clear.


Recap 26 Apr
EUR - D closed a shooting star with 1.3000 holding. Range trading continues.
Result: Narrow range day again.
GU - D positive close breaking the immediate range. We will have to see if there is follow through from the news reaction yesterday. 4hr on higher low with resistance from yesterdays high, W M5. Looks like we potentially have divergence. Bias up, potential to fall from double top.
Result: Moved lower from the double top. The move below the Asian lows strongly rejected with an engulfing close on 1hr, little/no upper wick.
EJ - D closed narrow range, inside candle, doji. 4hr has signaled lower but there has been higher volume coming in above 128.50. No bias.
Result: After London open two 1hr shooting stars. No follow through until early US session resumed move down with a small shooting star with little/no lower wick.


Friday, April 26, 2013
EUR GU EJ 26 Apr
EUR - D closed a shooting star with 1.3000 holding. Range trading continues.
GU - D positive close breaking the immediate range. We will have to see if there is follow through from the news reaction yesterday. 4hr on higher low with resistance from yesterdays high, W M5. Looks like we potentially have divergence. Bias up, potential to fall from double top.
EJ - D closed narrow range, inside candle, doji. 4hr has signaled lower but there has been higher volume coming in above 128.50. No bias.
Recap 25 Apr
EUR - D closed positive, a doji, the indecision continues. 4hr
divergence yesterday was followed by a move up during Asian session
signaled by 4hr higher low, 8lwma/RSI cross. We have been around the
1.3000 support level for 2 weeks now and if we look back at Feb-Apr '12
the current moves are certainly not the same as we saw then. The 4hr,
1hr flow is suggesting up but I have doubts based on the comparison
between now and Feb-Apr. The D has not yet signaled up, the 4hr signal
could have played out, no bias.
Result: News took EUR to the W pivot where it was sold off quickly down to the same 1.3000 support area.
GU - Essentially the same picture as EUR.
Result: News took GU up.
EJ - Still struggling, we are now in the 4th day following the weekly hammer with no follow through higher. No bias.
Result: Generally a choppy day.


Thursday, April 25, 2013
EUR GU EJ 25 Apr
No recap of 24th. Tight ranges yesterday, bounces off support levels but few set ups with what we would describe as good entry candles. The clean move happened during the Asian session.
EUR - D closed positive, a doji, the indecision continues. 4hr divergence yesterday was followed by a move up during Asian session signaled by 4hr higher low, 8lwma/RSI cross. We have been around the 1.3000 support level for 2 weeks now and if we look back at Feb-Apr '12 the current moves are certainly not the same as we saw then. The 4hr, 1hr flow is suggesting up but I have doubts based on the comparison between now and Feb-Apr. The D has not yet signaled up, the 4hr signal could have played out, no bias.
GU - Essentially the same picture as EUR.
EJ - Still struggling, we are now in the 4th day following the weekly hammer with no follow through higher. No bias.


Wednesday, April 24, 2013
EUR GU EJ 24 Apr
EUR - D negative close lower high 3 bar reversal, below 8lwma and below 50 level. 4hr lower high lower low flow in tact. Obviously the buyers at 1.30 may not have finished yet so care with entry required as always. We have W S1 at 1.2967 and this is the general area from Feb/Mar where there was also support. Bias down.
GU - D closed negative below 8 lwma and below RSI 50 level. The 1.52 level is still providing support but we did make a new low (with divergence on 4hr) and a lower high (1.5286 so regard divergence as having played out). There is the idea of what doesn't go down will go up but for now until price action confirms otherwise retaining down bias.
EJ - D closed again with a big lower wick bouncing off the Feb high. I am having difficulty reading EJ again today and can only suggest the trading basics of trend and support/resistance levels (i.e. trading the reaction to those levels).


Recap 23 Apr
EUR - D shooting star followed by a hammer, within the identified support/resistance levels.Overall bias down but with the support level 1.3000 holding would look elsewhere until the range breaks.
Result: Moved up to the W pivot 1.3084 and fell quickly in line with the bias but with a 60 pip entry candle not a set up we would trade.
GU - D positive close but again not very inspiring. 4hr positive divergence at the lows but that could have played out. 4hr evening star pattern suggests move lower. 4hr still on lower high lower low. Bias down until flow can switch positive.
Result: Down bias played out until 1hr lower wick clearly rejecting the move below W M2 1.5222.
EJ - D negative close with a lower wick. 4hr, 1hr flow on lower high lower low. Bias down until flow switches positive.
Result: Down bias played out until the Feb highs were reached and after approx 5 hours moved up.


Tuesday, April 23, 2013
EUR GU EJ 23 Apr
EUR - D shooting star followed by a hammer, within the identified support/resistance levels.Overall bias down but with the support level 1.3000 holding would look elsewhere until the range breaks.
GU - D positive close but again not very inspiring. 4hr positive divergence at the lows but that could have played out. 4hr evening star pattern suggests move lower. 4hr still on lower high lower low. Bias down until flow can switch positive.
EJ - D negative close with a lower wick. 4hr, 1hr flow on lower high lower low. Bias down until flow switches positive.


Recap 22 Apr
EUR - The support/resistance levels 1.3000-1.3120 are still containing
price. 1hr 50 ema flat signaling a general sideways range.
Had no bias, small range day.
GU - Lower high lower low flow, bias down.
Result: Bias down did not play out. The lows at 1.5200 held. A morning star pattern after London open did not give a 15 min higher low entry due to the upper wicks. The higher low 3 bar reversal after US open did give an entry. Despite the down bias buying buying here was in line with the counter trend rules. Support level, W M2 pivot, divergence on 4hr and 1hr, price proving over hours that it does not want to go lower.

EJ - Higher high higher low flow, bias up.
Result: Bias up did not play out. Price peaked at the identified previous high resistance area, divergence on 1hr. We got an entry on 15 min after the doji when it looked like a rally up failed.

Monday, April 22, 2013
EUR GU EJ 22 Apr
EUR - The support/resistance levels 1.3000-1.3120 are still containing price. 1hr 50 ema flat signaling a general sideways range.
GU - Lower high lower low flow, bias down.
EJ - Higher high higher low flow, bias up.


GU - Lower high lower low flow, bias down.
EJ - Higher high higher low flow, bias up.


Sunday, April 21, 2013
Clarification trading against direction of ma's
I was asked to clarify when I will trade against the direction of the charts moving averages, i.e. against the trend. So that would be selling when price is above the ma's and buying when price is below the ma's.
First of all an exception. Sometimes it does happen that the trend is so strong that I would ignore all counter trend signals. Counter trend candles are so weak they inspire no confidence at all. I can recall instances that lasted for weeks/months with EUR, EJ, EURCHF when I had absolutely no interest in any counter trend trades.
Please see the link http://vantagefx.blogspot.com/2013/02/trade-rules.html for the counter trend rules:
Trade counter trend from proven support and resistance levels and W pivots. Only when price has proven over a period of several hours that it does not want to continue in trend (specifically not 1 x 1hr candle). I will look to assess divergences and candle engulfing closes for patterns (higher low/lower high, double top/double bottom, morning/evening star) on 1hr that by their very definition require several hours to complete.
A few words of clarification:
Proven support and resistance. No hard and fast rules but visually price should have historically struggled with that level. I am looking to trade the reaction. Has price visibly reacted differently than before. See the 4hr chart for GU. 1.5400 was a proven level. On 17 April we had upper wicks and dojis in the Asian session. That can explain the muted reaction but when London open price fell. When price challenged that level again on 19th the reaction lower was immediate. On the 1hr, if the green doji was followed by an engulfing positive close the focus would have been on trend continuation higher. Instead we had an intra day lower high 3 bar reversal negative close. Price has proven over multiple candles that it does not want to continue higher.


Divergence. I don't trade higher time divergence, 1hr and higher, as a standalone occurrence. So it needs to be at a level that logically should support the change of direction. Proven support/resistance, pivots, fib levels, trend lines/channels. Price action must confirm the divergence. For me thats the candle patterns I specifically look for being double tops/bottoms, higher lows/lower highs, morning/evening star patterns, 3 bar reversals. I have done several posts on higher lows following divergence and lower highs following divergence.
http://vantagefx.blogspot.com/2013/03/4hr-charts-w-pivots-lower-highshigher.html
http://vantagefx.blogspot.com/2013/03/recap-20-mar-eur-higher-low-following.html for the EUR trade
http://vantagefx.blogspot.com/2013/04/analysis-of-losing-trade-then-lower.html
There are many more examples.
Ralph Shell article
See the link COT reports by Ralph Shell and go to articles for his update Bank of Japan's Kuroda Goes to Washington.
From the looks of things it looks like there won't be too much opposition to BOJ's efforts to stimulate their economy.
From the looks of things it looks like there won't be too much opposition to BOJ's efforts to stimulate their economy.
Saturday, April 20, 2013
Weekly charts
EUR - We appear to be forming the right shoulder in a head and shoulders pattern. Lots of things need to unfold, firstly to trade lower following this weeks negative close that seems to have rejected a move up. We need to get to 1.2700 neckline area and that needs to fail. That is a proven support area. If it does fail the measured move (high to neckline) should be mirrored below the neckline, implying a target 1.2000 and under.
GU - An evening star pattern 3 bar reversal suggests downside.
EJ - Hammer closing at the weeks highs, suggests upside.


GU - An evening star pattern 3 bar reversal suggests downside.
EJ - Hammer closing at the weeks highs, suggests upside.


4hr charts W pivots
As usual shows the importance of support/resistance levels, W pivots and the number of good moves. This week 4-5 per pair.


Why recap previous days price action?
I have been asked why do I do recaps of previous days trading. The answer is very simple.
So when you get this kind of lower high over 4hrs a sell would not be a complete surprise.

- It absolutely tells me if my take on trading is working for me or if it needs tweaking. In a nutshell, trade with the trend until counter trend rules apply.
- Hopefully its showing that you actually can get a good idea of the market before it happens (daily view is done a couple of hours before London open) and that (news spikes excluded) trades can be expected or taken with more confidence.
- Helps with understanding the subtleties that different pairs have, size of candles to avoid, times to trade etc etc.
So when you get this kind of lower high over 4hrs a sell would not be a complete surprise.

Recap 19 Apr
EUR - D closed a shooting star off the 1.3000 support level which is
proving a tough nut to crack. The bounce up was not significant enough
to change my down bias with obvious chance of buyers at the support
level.
Result: Up and down day with little follow through.
GU - D closed positive but a weak close, still below 8lwma and RSI not crossed higher. 4hr just closed positive so strictly speaking not on lower higher lower low. We are above 50 RSI on all 3 time frames so bias up but a move lower would be no surprise.
Result: Up and down day but much cleaner that EUR's 1hr chart. Move up in line with 4hr higher low 3 bar reversal. Move down from the W M3 pivot/general resistance area identified on D charts.
EJ - D close still unconvincing. 4hr positive so would expect some move up. A reversal down again would be no surprise.
Result: Move up as per bias but after London open no follow through.


Friday, April 19, 2013
EUR GU EJ 19 Apr
EUR - D closed a shooting star off the 1.3000 support level which is proving a tough nut to crack. The bounce up was not significant enough to change my down bias with obvious chance of buyers at the support level.
GU - D closed positive but a weak close, still below 8lwma and RSI not crossed higher. 4hr just closed positive so strictly speaking not on lower higher lower low. We are above 50 RSI on all 3 time frames so bias up but a move lower would be no surprise.
EJ - D close still unconvincing. 4hr positive so would expect some move up. A reversal down again would be no surprise.


Subscribe to:
Posts (Atom)