Friday, February 27, 2015

London open 27 Feb '15

Perfect example of test or break and test of range this morning. Moves up fail, clean AB moves lower, test of range or break and test of range (depends on which pair you look at), small BC retrace to set up the lower high, GBP weak across the board.


Monday, February 23, 2015

GBPAUD trade 23 Feb '15 151 pips

A strong negative close on the D last Friday had no follow through lower in Asian session. In the general support/resistance area from last weeks lows and W M2. A strong positive close (3 bar reversal) on 1hr and positive divergence on 4hr. 15 min higher low. Take profit loaded just below Fri's high +151 pips.

Friday, February 20, 2015

EURAUD 2 trades +60 and +58

Saw that AUD was strong across many pairs in particular against EUR and GBP. Later in move EUR weakness came in. See the two top 8 lists.

Exited the two trades as shown for a total of 118 pips and a return of over 20% for the morning.


Thursday, February 19, 2015

London open 19 February '15

I was not in front of the computer at all this morning so did not trade these set ups. This then is just another example of the London open test or break and test of the range.

Please see the range as per the red lines on the gbpaud and gbpnzd charts (their correlation works nicely) after London open (green line). Moves lower fail, clean AB move to break range, higher lows and agreement across pairs (see the euraud and eurnzd charts) which were above their 100lwma's and moving higher.


Wednesday, February 18, 2015

GBPAUD trade 200 pips

Price came down to W M2 where we exited the sell for 336 pips. This level was resistance from 3-10 Feb '15. It drifted there for hours showing positive divergence on both 4 and 1hr charts. Bought 1.9626 exited for +200.

GBPAUD trade 336 pips

Identified a support/resistance level going back years. Sold a shorter time frame lower high. Exit when W M2 held for some time for +336.

Tuesday, February 17, 2015

EURAUD trade 230 pips

Identified 1.4730-4800 as a resistance area. Sold a shorter time frame lower high 1.4770 exited at W M2, our over night take profit for 230 pips.

Saturday, February 14, 2015

London open trades Friday

I didn't trade at all on Friday so this is just an example.

I have been asked what happens if a London open trade in one direction fails.

The 6 pairs we mainly watch (gbp and eur with aud, jpy and nzd) trend well. The number of days where there won't be movement and they range completely sideways are few in number. Part of the reason is, as mentioned, they simply do trend well. Part of the reason is we are filtering moves out where there is no agreement, there is no general strength/weakness.

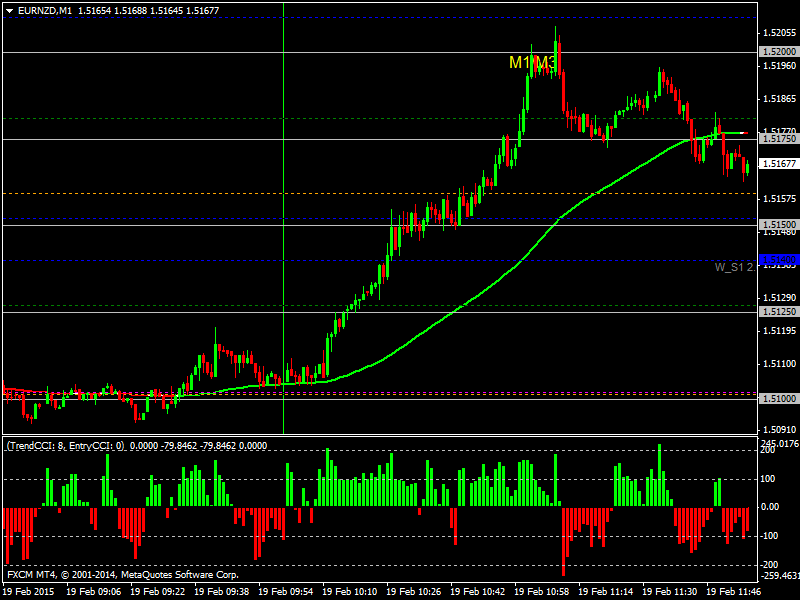
In the screen shots below going into London open (green line) both gbpaud and euraud are moving up making higher lows. This suggests aud is weak and both eur and gbp are strong. To choose which pair to trade we would look at other gbp and eur pairs. Which currency has other pairs moving up? We feel this filter has the best chance of picking a pair that will give some movement.

Should the trade fail we are risking around 15 pips. Then we will be looking at price action. In this example we were be looking to buy. Should that fail for us to consider a sell we'd be looking at our trade rules for price to move cleanly below the moving average (clean AB move), to test the lower range or break and test the lower range, to have a small BC retrace and to have the agreement across pairs to confirm strength/weakness.

Thankfully when the rules are met failed moves in both directions after London open in pairs that have strength/weakness are few in number. When the move does occur the pairs give trades far bigger than the loss of any initial failed move.


Wednesday, February 11, 2015

London open trades

Just showing yet again to give an idea how often this sets up.

GBPAUD moves up from low of range to top of range around 1.9640 at London open (green line), see the red arrow up. GBPNZD and GBPJPY do the same suggesting GBP general strength. EURAUD has a similar move up suggesting AUD weakness as both GBPAUD and EURAUD moving up.

So I am happy that trading GBPAUD is good strength v weakness,

From here the next 1 min higher lows can be bought. The 1 min chart attached shows what might be my last trade for the day.


Monday, February 9, 2015

Avoid weak pre/early US open counter trend candles

As we have often discussed we would avoid getting involved with weak counter trend moves and rather look for the US session to continue the direction set by London. Not saying we would never be buyers but would look for more than 1 weak reversal candle.


Strength/weakness at a glance

Referring to the previous post.

These are the 5 min charts for GBPAUD, EURAUD and GBPNZD. I am looking to try and gauge agreement between pairs from the charts to determine strength and weakness.

Here the 3 pairs are agreeing as at London open (green line). They are all below their purple lines, have failed at highs of their immediate ranges and making lower highs. GBPAUD and EURAUD agreeing suggests AUD strength. GBPNZD agreeing with GBPAUD suggests GBP weakness. As mentioned before I have been watching the GBP NZD/AUD correlation for some time now.

Once I get this agreement I am happy that a pair has broader strength/weakness and then looking to time my entry from a retrace on 1 min chart.


London open trade rules

Clean AB move lower, break and test of range (red line on chart), small BC retrace to form lower high. EURAUD agreeing as was GBPNZD (the correlation between GBPAUD and GBPNZD I have been watching for some time now).


Sunday, February 8, 2015

US session entry from lower time frames

These rules are essentially the same as the London open rules. Trading with the higher time frame trend with entry timed from 1 min (or 5 min) charts. Many traders would say the 1 min is noise, this method attempts to reduce the noise by trading with trending pairs with genuine strength/weakness and entering on retracements (higher lows, lower highs).

- there is often a period of drift after London morning moves, this could be to form a range or small counter (the days) trend move.
- in the absence of a strong counter trend move we would be looking for the US session to revert to the direction set by London.
- trading where currencies are agreeing across 2 or more pairs. It could be both the eur and gbp against either aud, jpy, nzd or cad. Or it could be eur or gbp strong/weak across multiple pairs. See some of the 1/5 min charts posted in January that clearly show the idea, which is to be trading a currency that has genuine strength or weakness.
- higher lows or lower highs (abc or 123 patterns) for entry.
- the test or break and test of a range.
- trading buy above, sell below the 1 min 100 lwma (20 lwma on 5 min) looking for clean AB moves and small BC retraces to set up clean higher lows/lower highs.
- thereafter continuing to take higher lows/lower highs with strongly moving pairs.
- taking care to avoid trading the major news events that can be highly volatile.  

4hr charts W pivots

As usual the 4hr charts show the importance of the W pivots, support and resistance levels and the number of decent moves (2 - 5) that can typically be expected in a week.


US open compared to London open

I was asked if this method is also applicable to the US open and to give some suggestions on trading at that time.

A search of this blog for "avoid weak counter trend candles" will show numerous posts with charts that you can have a look at.

If you are trading the 1 hr charts you can be looking for "good" candles that revert to the days trend or where price respects a support/resistance level for hours.

Good candles likely to fall into the engulfing, large wick rejecting a move or 3 bar reversal category (for sells a close below the previous 2 candle closes where 1 must have been a positive close and for buys a close above the previous 2 candle closes where 1 must have been a negative close). Due to the 3 bar reversal definition this implies a true counter trend move and a close back into trend.

If you are trading smaller time frames you could be looking at higher low, lower high entries following the close of a 1hr candle.

Nothing works all the time and the big US news events can be very volatile but these charts show several examples of good candles following through and of course those that don't. Often with a failure the candles high/low is respected so trading a few pips beyond the range would keep you out of a lot of failed trades.

At the moment I am looking at lower time frames for entry.


Thursday, February 5, 2015

Test or break and test of range

We have been looking at these for some time, just another two examples.